Data Heatmap
[1]:
import pandas as pd
from data_describe import data_heatmap
[2]:
from sklearn.datasets import load_wine
data = load_wine()
df = pd.DataFrame(data.data, columns=list(data.feature_names))
df['target'] = data.target
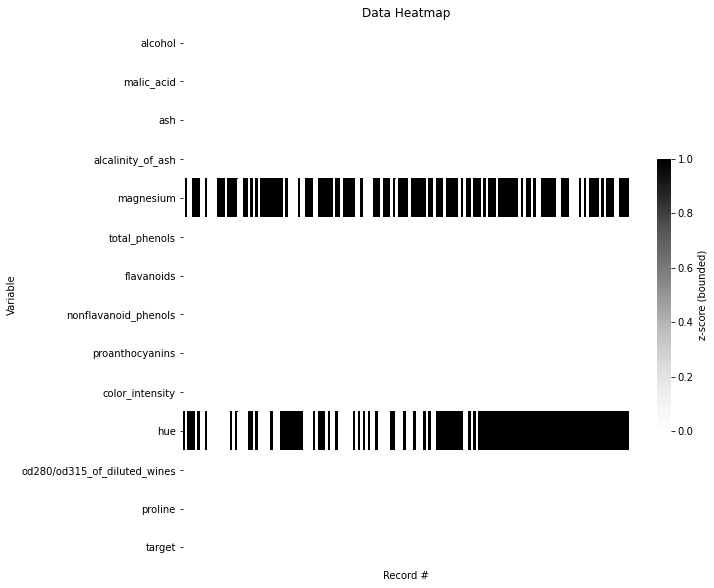
Missing values only
[4]:
# Create missing values
df['hue'] = df['hue'].map(lambda x: None if x < 1.05 else x)
df['magnesium'] = df['magnesium'].map(lambda x: None if x%2 ==0 else x)
[5]:
data_heatmap(df, missing=True)

[5]:
Heatmap Widget showing missing values.
Interactive (Plotly)
[6]:
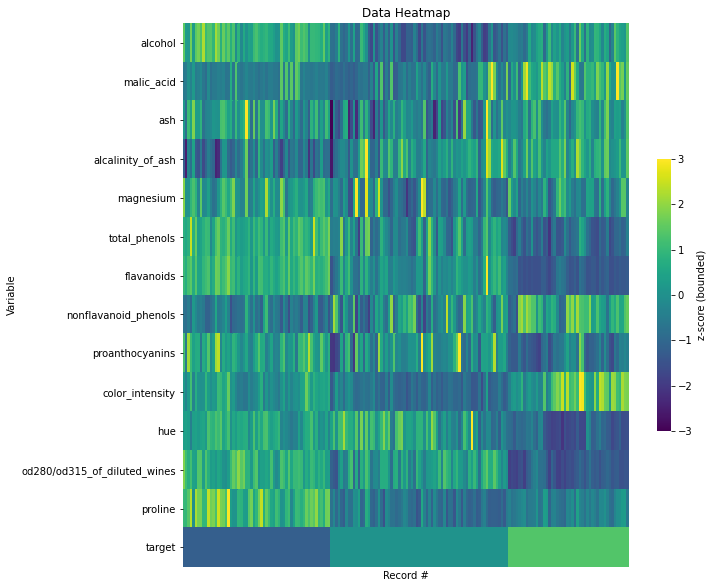
data_heatmap(df, viz_backend="plotly")
C:\workspace\data-describe\data_describe\compat\_notebook.py:32: JupyterPlotlyWarning:

Are you running in Jupyter Lab? The extension "jupyterlab-plotly" was not found and is required for Plotly visualizations in Jupyter Lab.
None
[6]:
Heatmap Widget showing standardized values.
[7]:
data_heatmap(df, viz_backend="plotly", missing=True)
None
[7]:
Heatmap Widget showing missing values.
