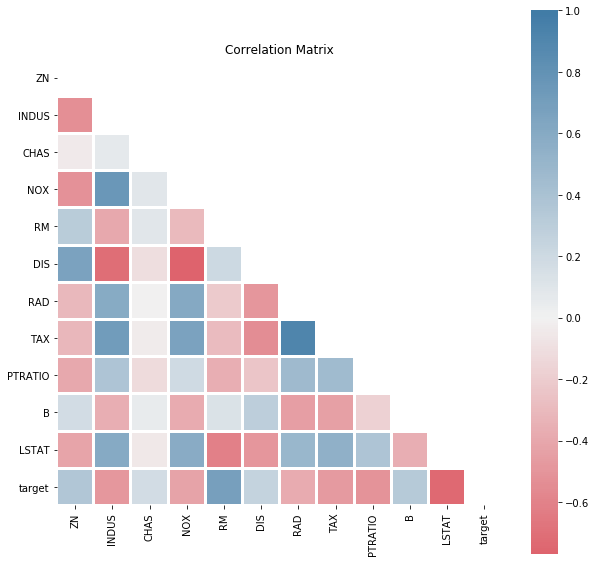
Correlation Matrix
[1]:
import pandas as pd
import data_describe as dd
[2]:
from sklearn.datasets import load_boston
data = load_boston()
df = pd.DataFrame(data.data, columns=list(data.feature_names))
df['target'] = data.target

#Bin values
df['AGE'] = df['AGE'].map(lambda x: "young" if x < 29 else "old")
df['CRIM'] = df['CRIM'].map(lambda x: "low" if x < df.CRIM.median() else "high")
#Convert to integer
df['ZN'] = df['ZN'].astype(int)
[3]:
df.head(2)
[3]:
| CRIM | ZN | INDUS | CHAS | NOX | RM | AGE | DIS | RAD | TAX | PTRATIO | B | LSTAT | target | |
|---|---|---|---|---|---|---|---|---|---|---|---|---|---|---|
| 0 | low | 18 | 2.31 | 0.0 | 0.538 | 6.575 | old | 4.0900 | 1.0 | 296.0 | 15.3 | 396.9 | 4.98 | 24.0 |
| 1 | low | 0 | 7.07 | 0.0 | 0.469 | 6.421 | old | 4.9671 | 2.0 | 242.0 | 17.8 | 396.9 | 9.14 | 21.6 |
Default
[4]:
dd.correlation_matrix(df)
<matplotlib.axes._subplots.AxesSubplot at 0x1a0a38c66c8>
[4]:
<data_describe.core.correlations.CorrelationMatrixWidget at 0x1a0a2ea5548>
Enable clustering
[5]:
dd.correlation_matrix(df, cluster=True, viz_backend="plotly")
None
[5]:
<data_describe.core.correlations.CorrelationMatrixWidget at 0x1a0a5b59e88>
Show categorical features
WARNING: When using categorical features, the matrix represents strength of association (i.e. in the scale [0, 1]). This is because it is hard to define the meaning of a negative association involving a categorical feature.
[6]:
dd.correlation_matrix(df, categorical=True, viz_backend="plotly")
None
[6]:
<data_describe.core.correlations.CorrelationMatrixWidget at 0x1a0a5d585c8>
Return values only
[7]:
correlation_widget = dd.correlation_matrix(df)
correlation_widget.viz_data
[7]:
| ZN | INDUS | CHAS | NOX | RM | DIS | RAD | TAX | PTRATIO | B | LSTAT | target | |
|---|---|---|---|---|---|---|---|---|---|---|---|---|
| ZN | 1.000000 | -0.533583 | -0.042533 | -0.516310 | 0.312218 | 0.663845 | -0.311712 | -0.314338 | -0.391203 | 0.175341 | -0.413195 | 0.360580 |
| INDUS | -0.533583 | 1.000000 | 0.062938 | 0.763651 | -0.391676 | -0.708027 | 0.595129 | 0.720760 | 0.383248 | -0.356977 | 0.603800 | -0.483725 |
| CHAS | -0.042533 | 0.062938 | 1.000000 | 0.091203 | 0.091251 | -0.099176 | -0.007368 | -0.035587 | -0.121515 | 0.048788 | -0.053929 | 0.175260 |
| NOX | -0.516310 | 0.763651 | 0.091203 | 1.000000 | -0.302188 | -0.769230 | 0.611441 | 0.668023 | 0.188933 | -0.380051 | 0.590879 | -0.427321 |
| RM | 0.312218 | -0.391676 | 0.091251 | -0.302188 | 1.000000 | 0.205246 | -0.209847 | -0.292048 | -0.355501 | 0.128069 | -0.613808 | 0.695360 |
| DIS | 0.663845 | -0.708027 | -0.099176 | -0.769230 | 0.205246 | 1.000000 | -0.494588 | -0.534432 | -0.232471 | 0.291512 | -0.496996 | 0.249929 |
| RAD | -0.311712 | 0.595129 | -0.007368 | 0.611441 | -0.209847 | -0.494588 | 1.000000 | 0.910228 | 0.464741 | -0.444413 | 0.488676 | -0.381626 |
| TAX | -0.314338 | 0.720760 | -0.035587 | 0.668023 | -0.292048 | -0.534432 | 0.910228 | 1.000000 | 0.460853 | -0.441808 | 0.543993 | -0.468536 |
| PTRATIO | -0.391203 | 0.383248 | -0.121515 | 0.188933 | -0.355501 | -0.232471 | 0.464741 | 0.460853 | 1.000000 | -0.177383 | 0.374044 | -0.507787 |
| B | 0.175341 | -0.356977 | 0.048788 | -0.380051 | 0.128069 | 0.291512 | -0.444413 | -0.441808 | -0.177383 | 1.000000 | -0.366087 | 0.333461 |
| LSTAT | -0.413195 | 0.603800 | -0.053929 | 0.590879 | -0.613808 | -0.496996 | 0.488676 | 0.543993 | 0.374044 | -0.366087 | 1.000000 | -0.737663 |
| target | 0.360580 | -0.483725 | 0.175260 | -0.427321 | 0.695360 | 0.249929 | -0.381626 | -0.468536 | -0.507787 | 0.333461 | -0.737663 | 1.000000 |